Ads (Google Ads Integration)
Introduction
For eCommerce merchants and agencies, driving traffic is only half the battle—that traffic needs to convert. However, technical site issues, slow load times, or unexpected downtime can quickly waste your advertising budget.
The Ads section in AuditIQ bridges the gap between marketing and technical health. By directly integrating your Google Ads accounts, you can monitor your advertising ROI alongside your website's performance data. This ensures you are never sending costly paid traffic to broken, slow, or offline pages.
Managing Multiple Google Ads Accounts
AuditIQ is built to scale with your business operations. Whether you are an agency managing multiple client portfolios or a merchant running different regional storefronts, the platform allows you to connect multiple Google Ads accounts to a single project.
- Ads Account Dropdown: Use the dropdown menu at the top of the dashboard to seamlessly toggle between your connected Google Ads profiles. This allows you to instantly isolate and view campaign data for specific stores or clients without leaving the AuditIQ portal.
Understanding Your Advertising Metrics
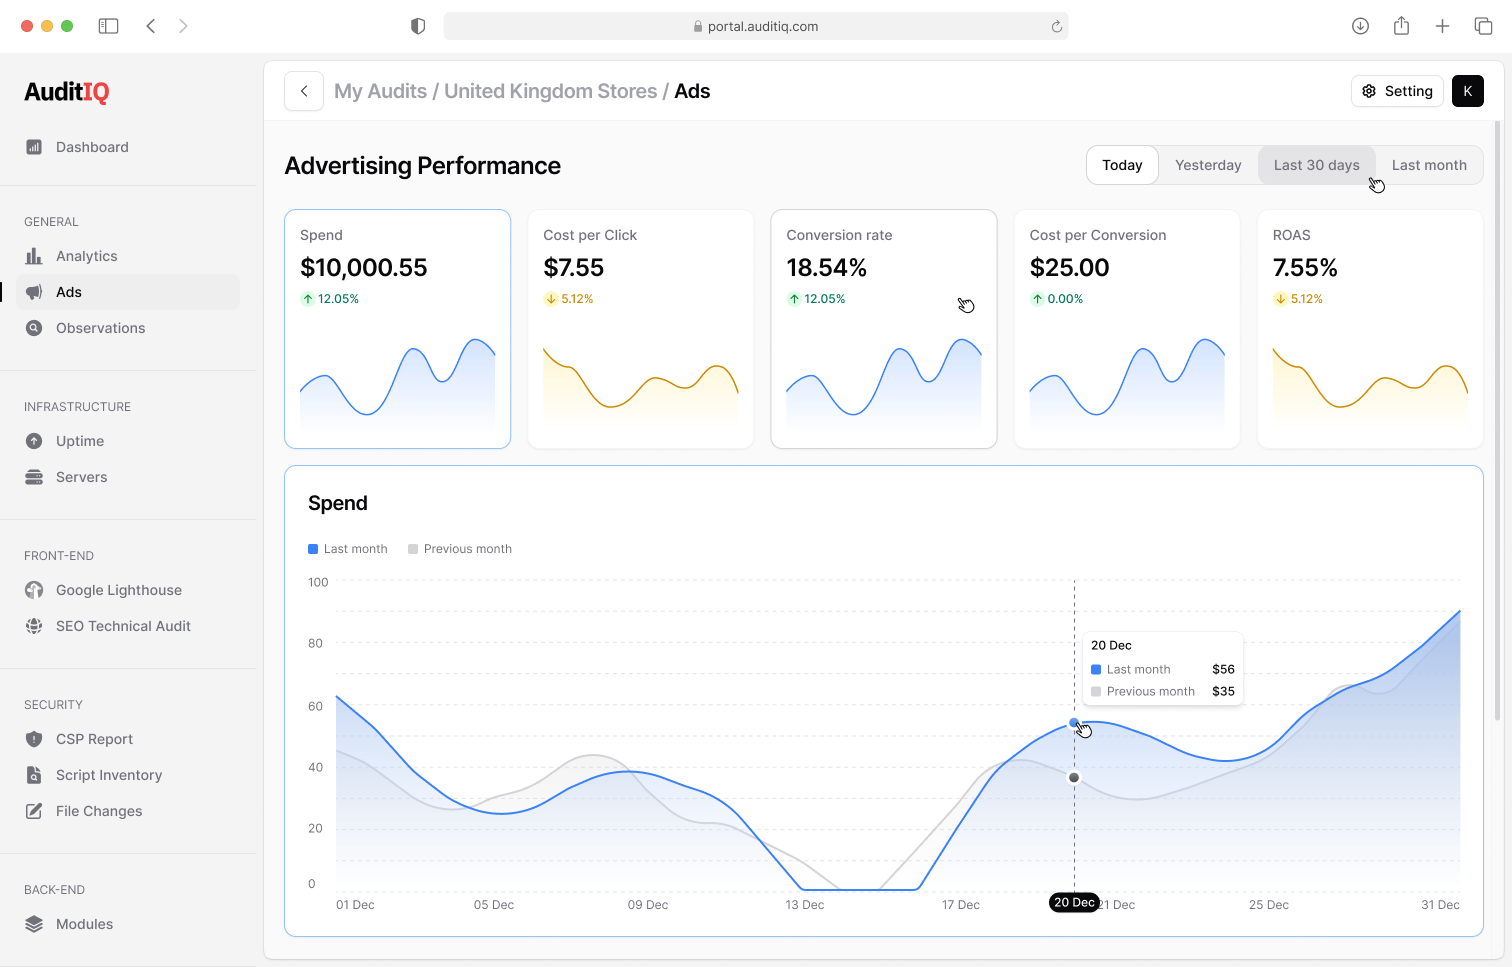
The dashboard provides a high-level summary of your most critical campaign KPIs. Each metric card includes trend indicators (percentage changes) to immediately show if performance is improving or declining compared to the previous period:
-
Spend: The total amount of budget utilized on your campaigns during the selected timeframe.
-
Cost Per Click (CPC): The average amount you pay each time a user clicks your ad.
-
Conversions: The total number of successful actions (such as completed checkouts or lead sign-ups) generated directly from your ad traffic.
-
Cost Per Conversion: Also known as CPA (Cost Per Acquisition), this shows how much you are spending on average to acquire one successful conversion.
-
ROAS (Return on Ad Spend): The ultimate metric for eCommerce profitability, displaying the percentage of revenue generated for every dollar spent on advertising.
Trend Analysis and Visualization
To make informed budget decisions and spot anomalies, you need to see how your campaigns perform over time:
-
Dynamic Time Filters: Quickly adjust your reporting window using preset intervals like Today, Yesterday, Last 30 days, or Last month.
-
Spend Visualization Chart: Below the KPI cards, an interactive chart allows you to visualize your daily Spend over time. This chart automatically overlays your current spend data against the corresponding previous period (e.g., Last month vs. Previous month), making it easy to spot unexpected budget spikes or sudden drops in ad momentum at a glance.