Uptime
Introduction
In eCommerce, every minute of downtime directly translates to lost revenue, frustrated customers, and a negative impact on your SEO rankings. Even if your site is technically "online," severe server lag can cause shoppers to abandon their carts.
The Uptime monitoring feature within AuditIQ’s Infrastructure suite acts as your digital heartbeat monitor. It continuously tracks the availability and responsiveness of your storefronts, ensuring that both merchants and managing agencies are the first to know if a site goes offline or begins to struggle under heavy traffic.
Understanding Your Uptime Metrics
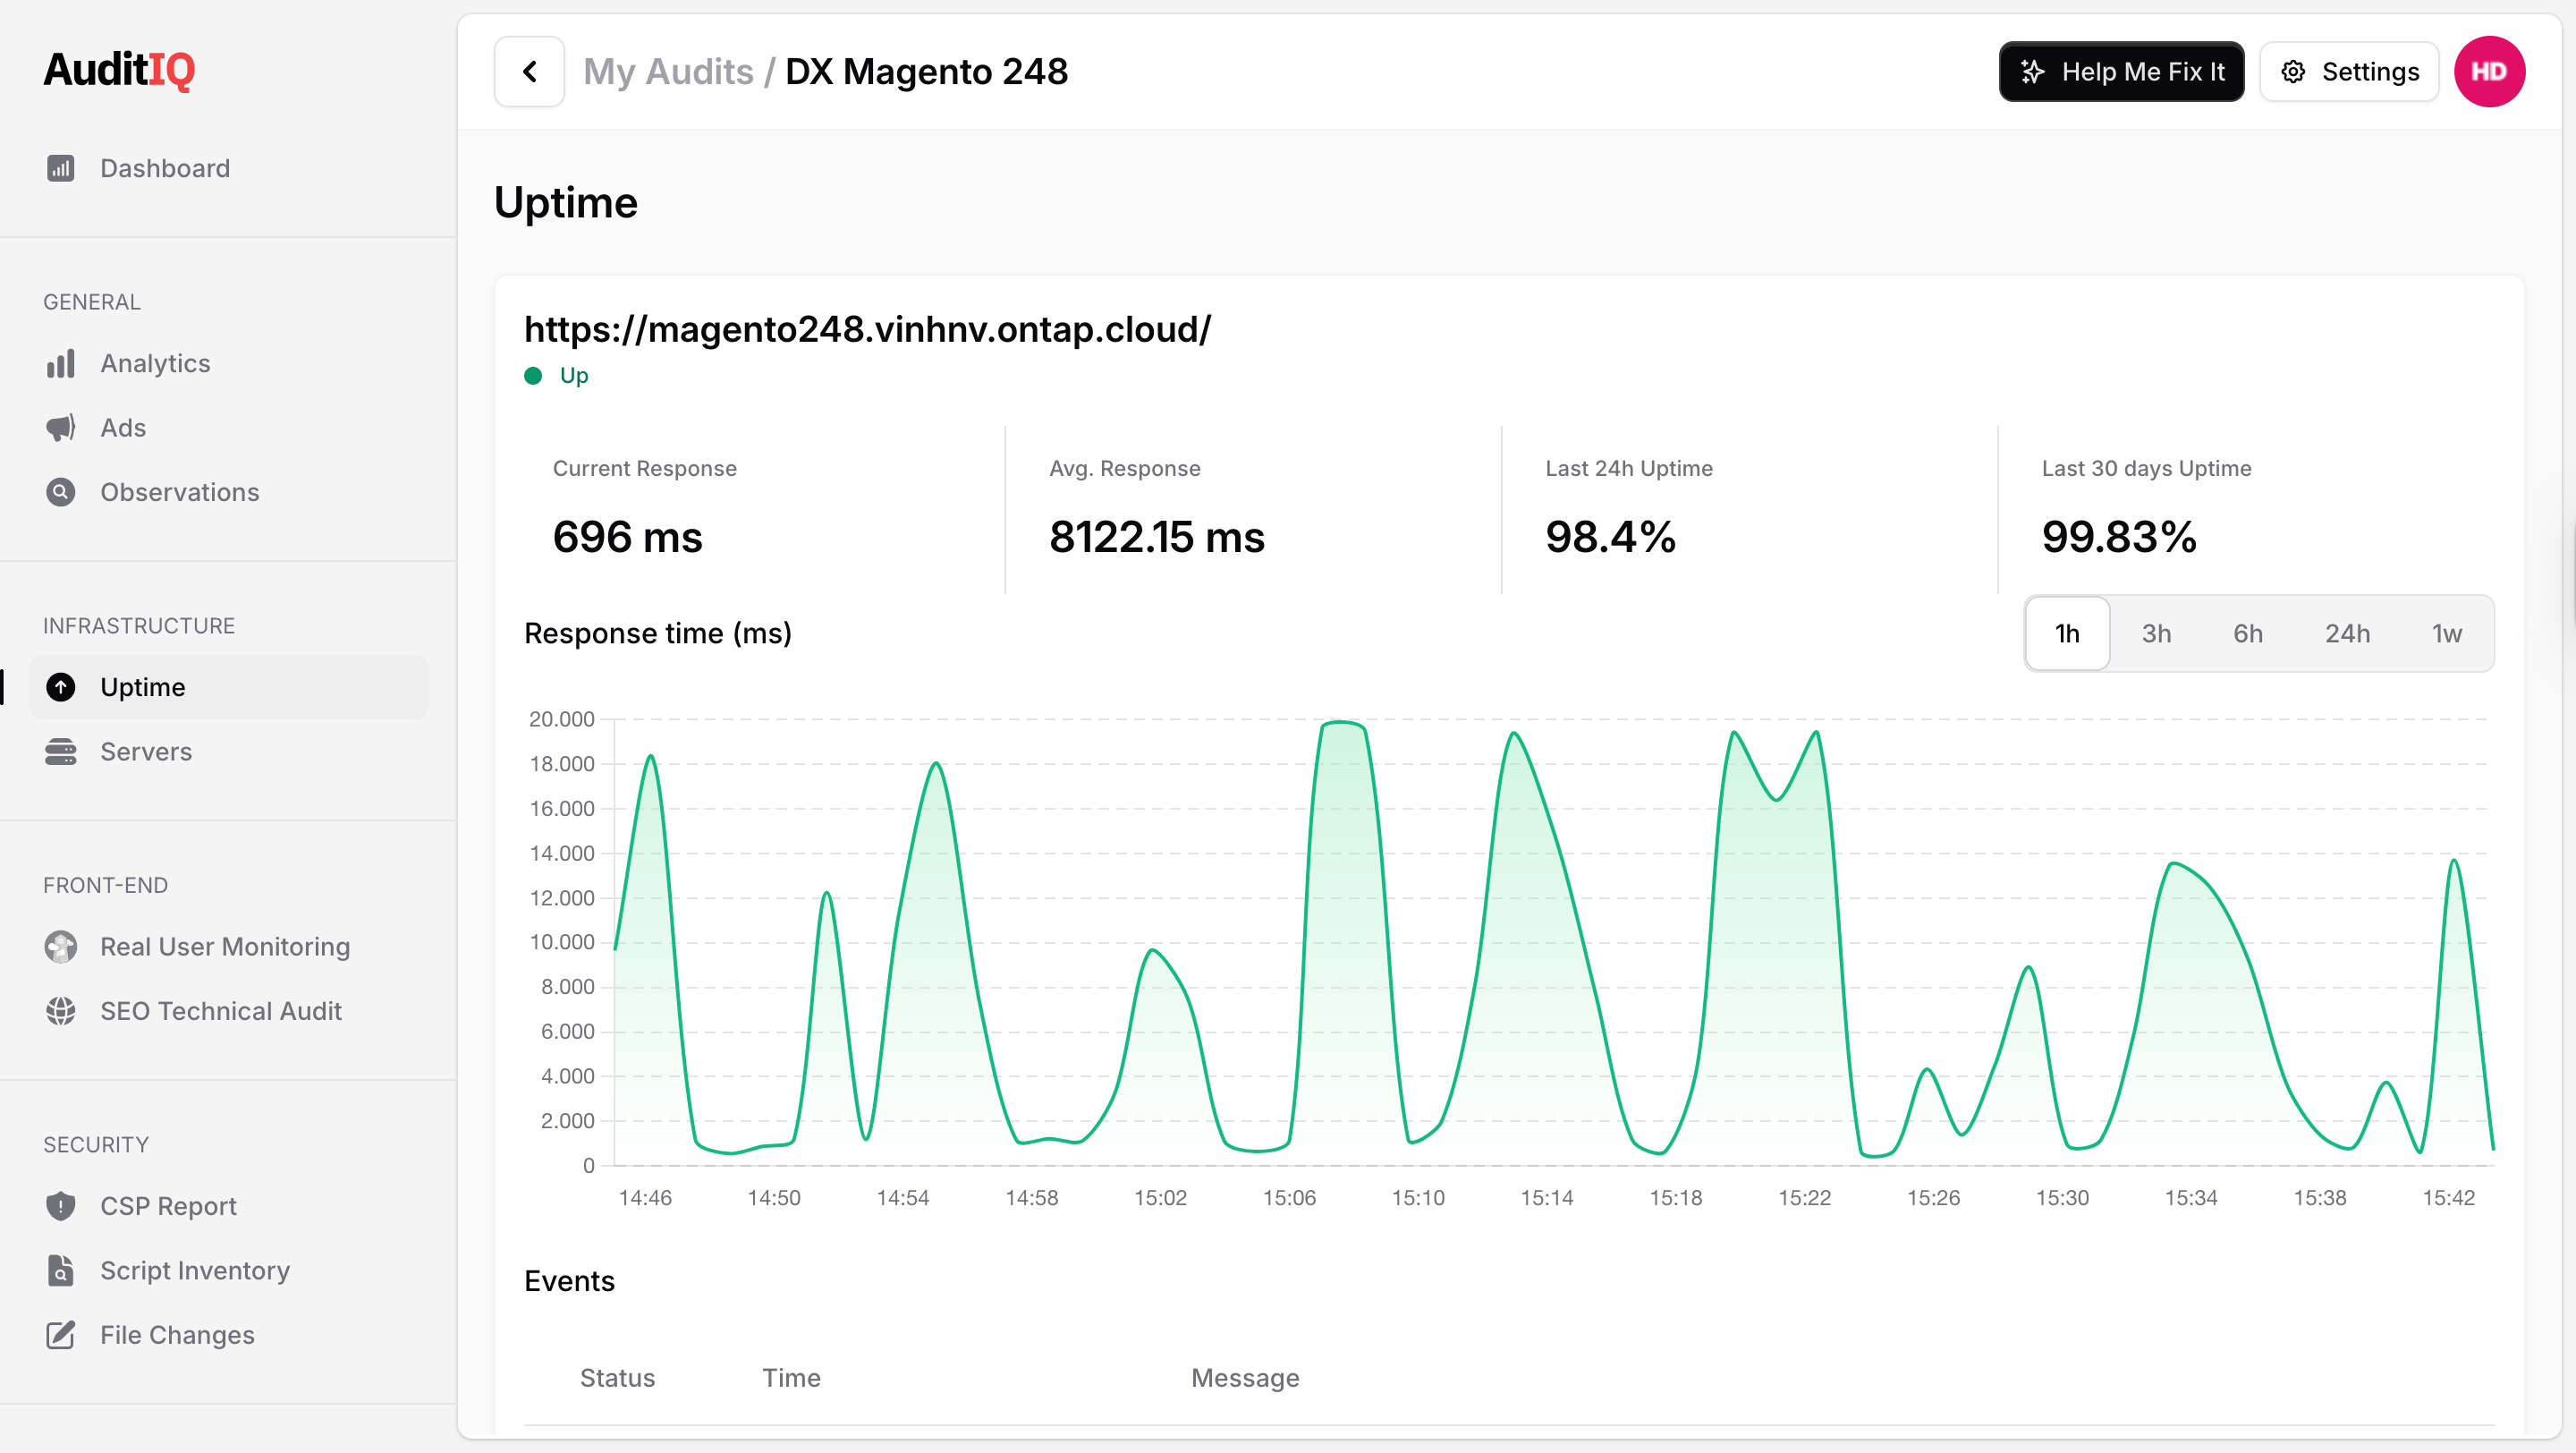
At the top of the dashboard, you will see the active status of your tracked domain (e.g., shop.example.com) along with a green "Up" or red "Down" indicator. Below this, four critical performance indicators provide a snapshot of your server's health:
-
Current Response: The exact time (in milliseconds) it took for your server to respond to AuditIQ's most recent automated ping.
-
Avg. Response: The average server response time over your monitored period, helping you establish a baseline for normal site speed.
-
Last 24h Uptime: The percentage of time your website was fully online and accessible over the past day.
-
Last 30 days Uptime: Your long-term availability percentage. This is a crucial metric for agencies proving their reliability to clients or for merchants verifying their hosting provider's Service Level Agreement (SLA).
Response Time Visualization
Spikes in response time are often the early warning signs of an impending server crash. The interactive Response time (ms) chart helps you visualize these fluctuations:
-
Interactive Trend Line: Easily spot patterns, such as server slowdowns during peak shopping hours or scheduled cron job executions.
-
Granular Time Filters: Use the toggle buttons on the right side of the chart to zoom in or out on specific intervals: 1h, 3h, 6h, 24h, or 1w (one week). This allows you to investigate a sudden latency spike that happened an hour ago or review broader performance trends over the week.
Event Logs & Troubleshooting
Below the chart, the Events ledger provides a chronological, timestamped history of your server's status changes. This is an invaluable tool for developers and IT teams during a post-mortem investigation.
-
Status & Time: See exactly when a site transitioned from "Up" to "Down," and how long it took to recover.
-
Message / Error Codes: Instead of just guessing why the site crashed, AuditIQ logs the specific HTTP response. You will see successful pings (200 - OK) as well as the exact error codes that caused the outage (e.g., Request failed with status code 500 or 522), empowering your team to fix the root cause faster.